Sliced inference for Cell Segmentation (Large Images)
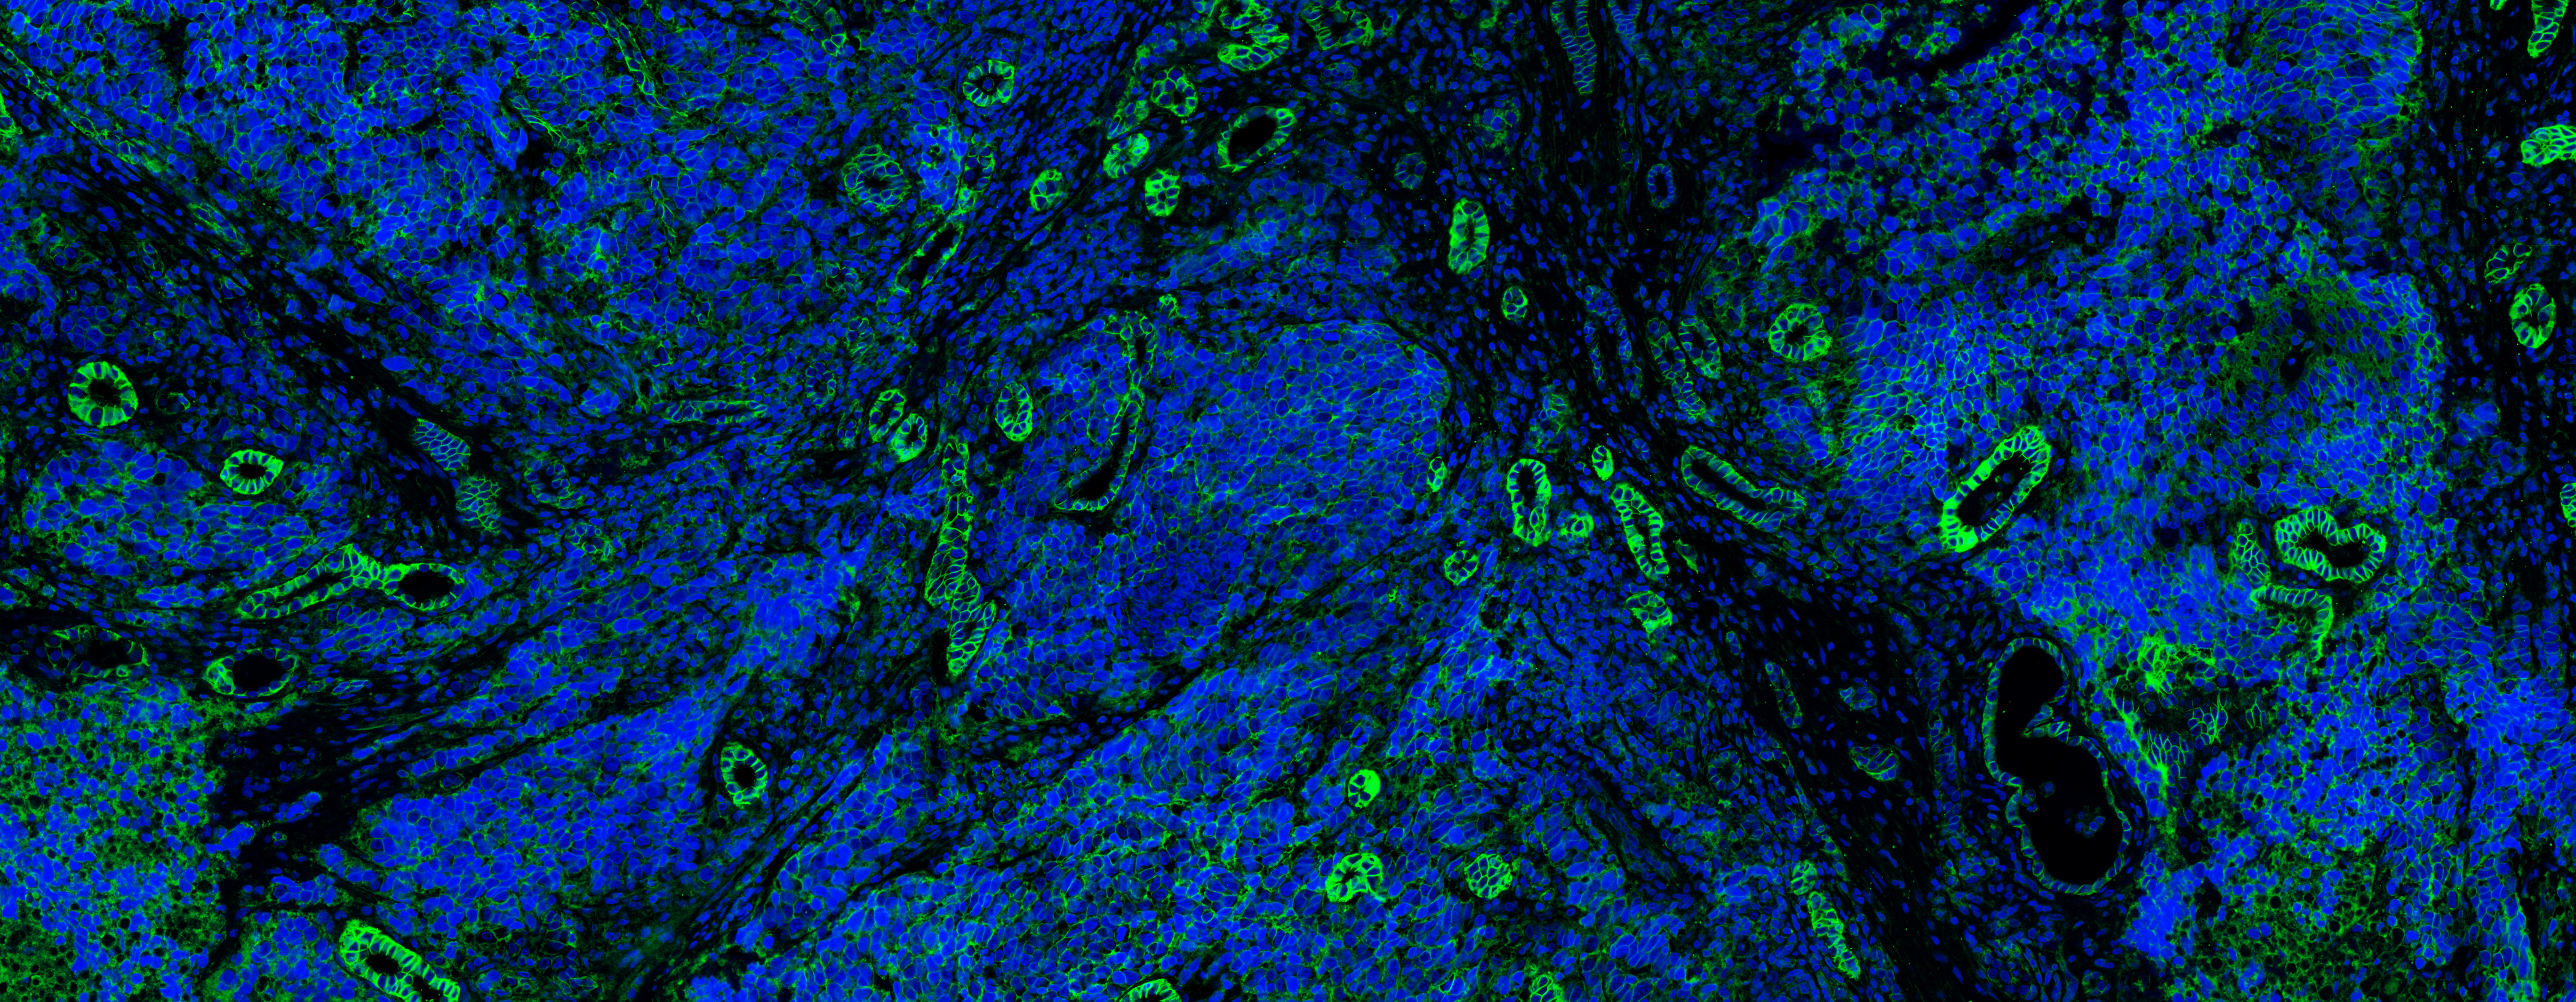
Process the input image
Convert the input images into an RGB format where the blue channel represents the nuclear channel, the green channel corresponds to the membrane channel.
Inference the sliced prediction based on SAHI library
Import required libraries
from sahi.utils.detectron2 import Detectron2TestConstants

# import required functions, classes
from sahi import AutoDetectionModel
from sahi_predict import get_sliced_prediction, predict, get_prediction
from sahi.utils.file import download_from_url
from sahi.utils.cv import read_image
from cellotype.predict import Detectron2DetectionModel
import numpy as np
from PIL import Image
Image.MAX_IMAGE_PIXELS = None
from tqdm import tqdm
import time
import logging
from deepcell.utils.plot_utils import create_rgb_image
from deepcell.utils.plot_utils import make_outline_overlay
from skimage import io
import matplotlib.pyplot as plt

def get_mask_from_result(result):
    obj_list = result.object_prediction_list
    output = np.zeros(result.image.size).T
    for i in tqdm(range(len(obj_list))):
        mask = obj_list[i].mask.bool_mask
        output[mask==True] = i+1
    return output
Run sliced inference
detection_model = Detectron2DetectionModel(
model_path='cellotype/models/tissuenet_model_0019999.pth',
config_path='cellotype/configs/maskdino_R50_bs16_50ep_4s_dowsample1_2048.yaml',
confidence_threshold=0.4,
image_size=512,
device="cuda:0", # or 'cuda:0'
channels=3,
)
img_path = 'data/example/example_large.png'
logging.info("Predicting...")
start = time.time()
result = get_sliced_prediction(
    img_path,
    detection_model,
    slice_height = 512,
    slice_width = 512,
    overlap_height_ratio = 0.05,
    overlap_width_ratio = 0.05,
    perform_standard_pred = False,
)
If the GPU memory is not enough, you can reduce the image_size, slice_height and slice_width to 256.
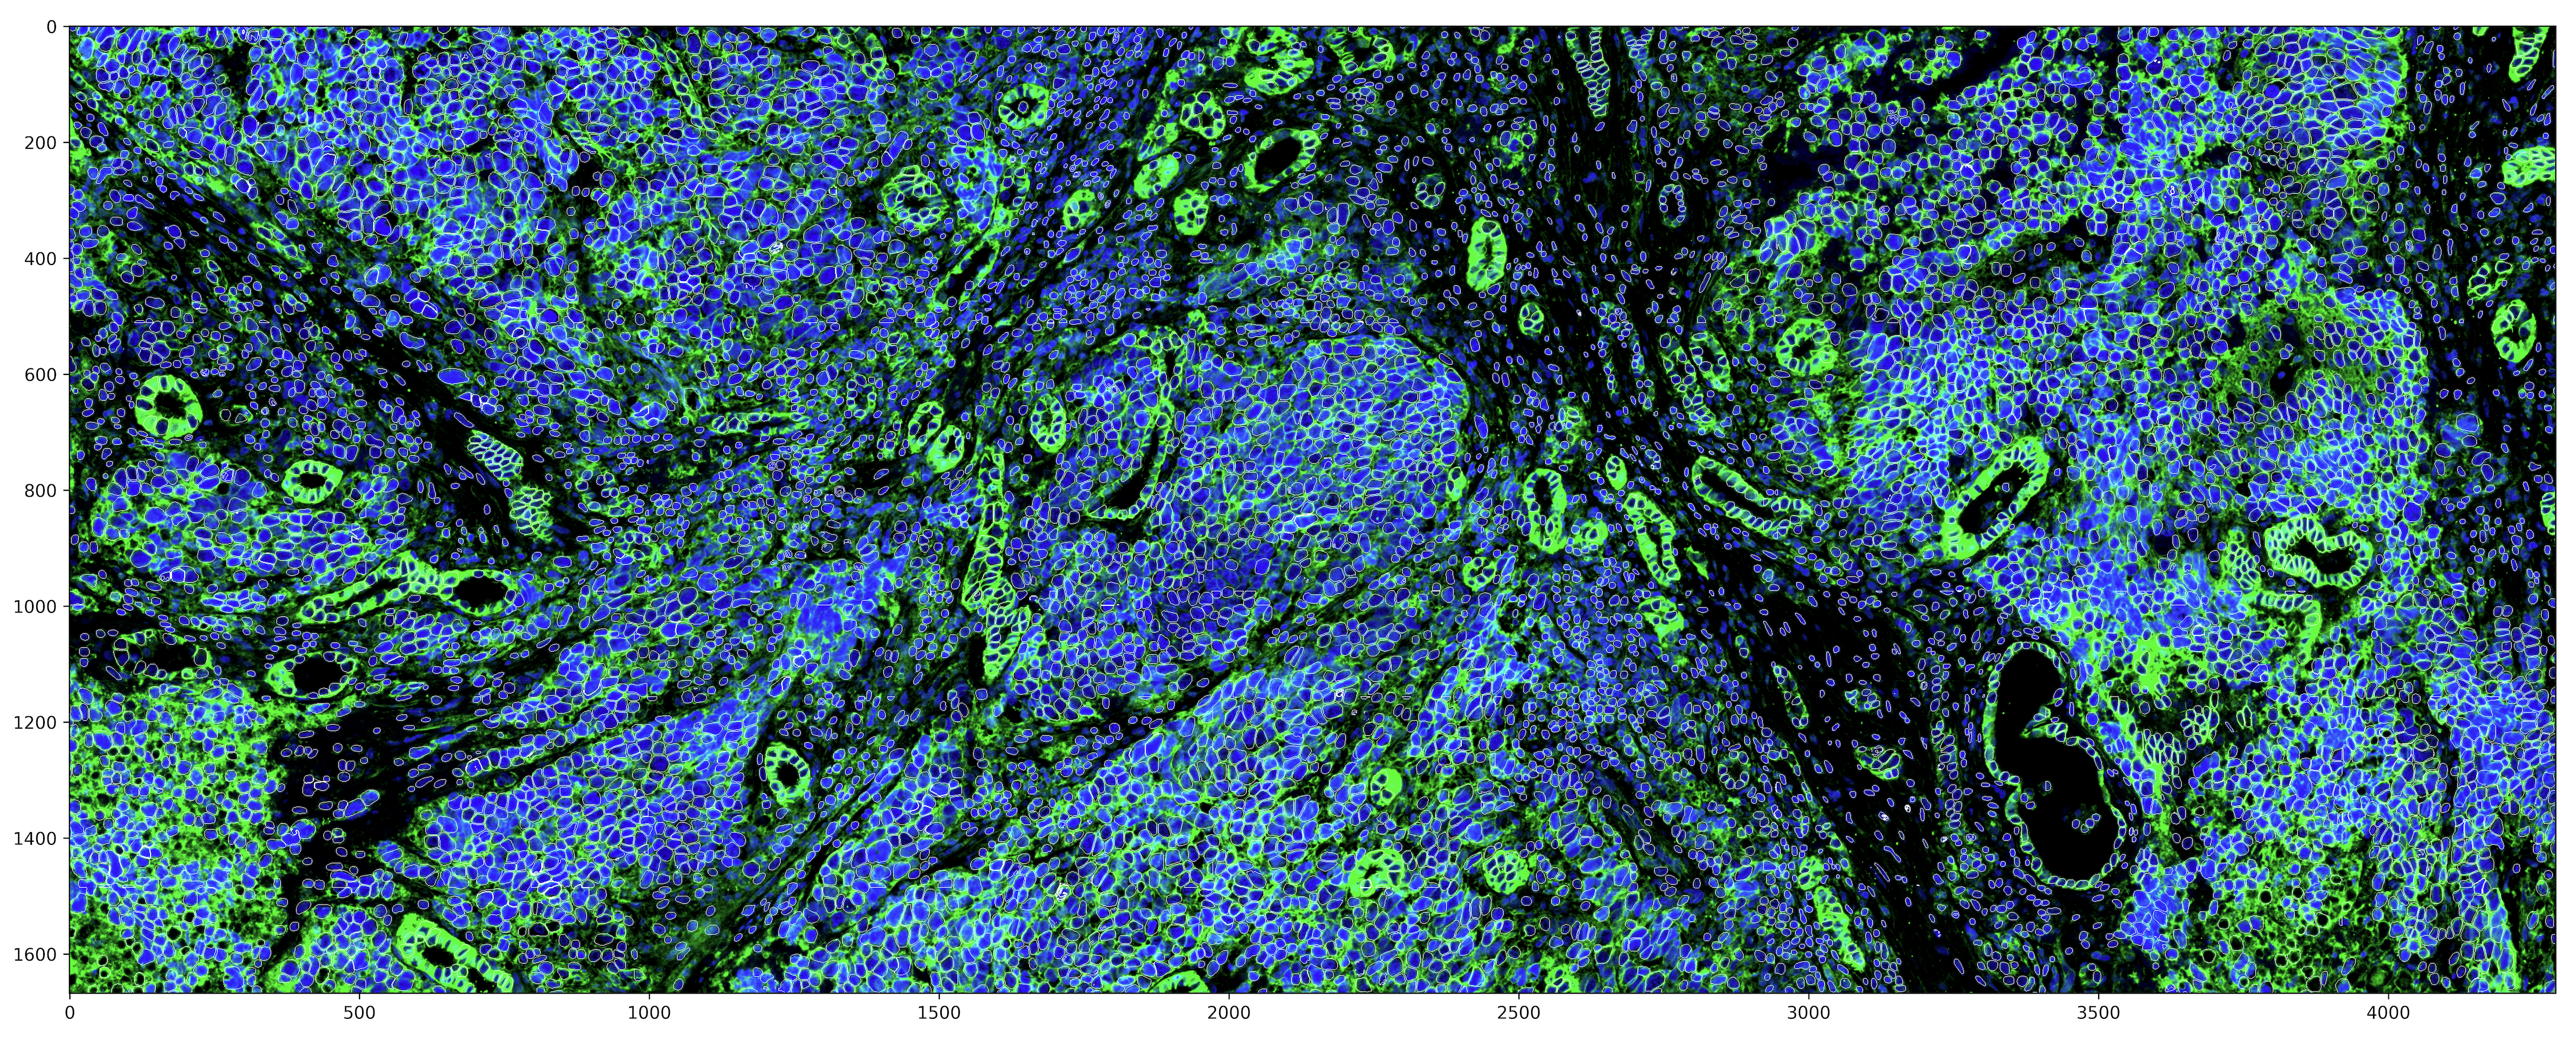
Save the result and visualization
output = get_mask_from_result(result)
im = Image.fromarray(output.astype('int32'))
im.save('figures/example_sahi.tif')

logging.info("Saving visualization results...")

output = get_mask_from_result(result)
img_data = io.imread(img_path)[:,:,[2,1]]
img_data = np.reshape(img_data, (1, img_data.shape[0], img_data.shape[1], 2))
rgb_image = create_rgb_image(img_data, channel_colors=['blue', 'green'])
fig = plt.figure(figsize=(30,10))
ax = fig.add_subplot(111)
ax.imshow(make_outline_overlay(rgb_image, predictions=np.reshape(output, (1, output.shape[0], output.shape[1], 1)))[0])
plt.savefig('figures/example_large.png', dpi=600)